

Introduction
Ever felt like you’re just treading water in the equipment manufacturing game? As the digital marketplace evolves, it’s crucial for manufacturers to focus on key ecommerce KPIs that can drive growth and enhance operational efficiency. Let’s explore ten key KPIs that every equipment manufacturer should keep an eye on, revealing how tools like GenAlpha's Equip360 can streamline this process and provide actionable insights.
So, what happens if you overlook these metrics? How can you make sure you’re using data to really boost your bottom line?
GenAlpha Technologies: Equip360 for KPI Tracking
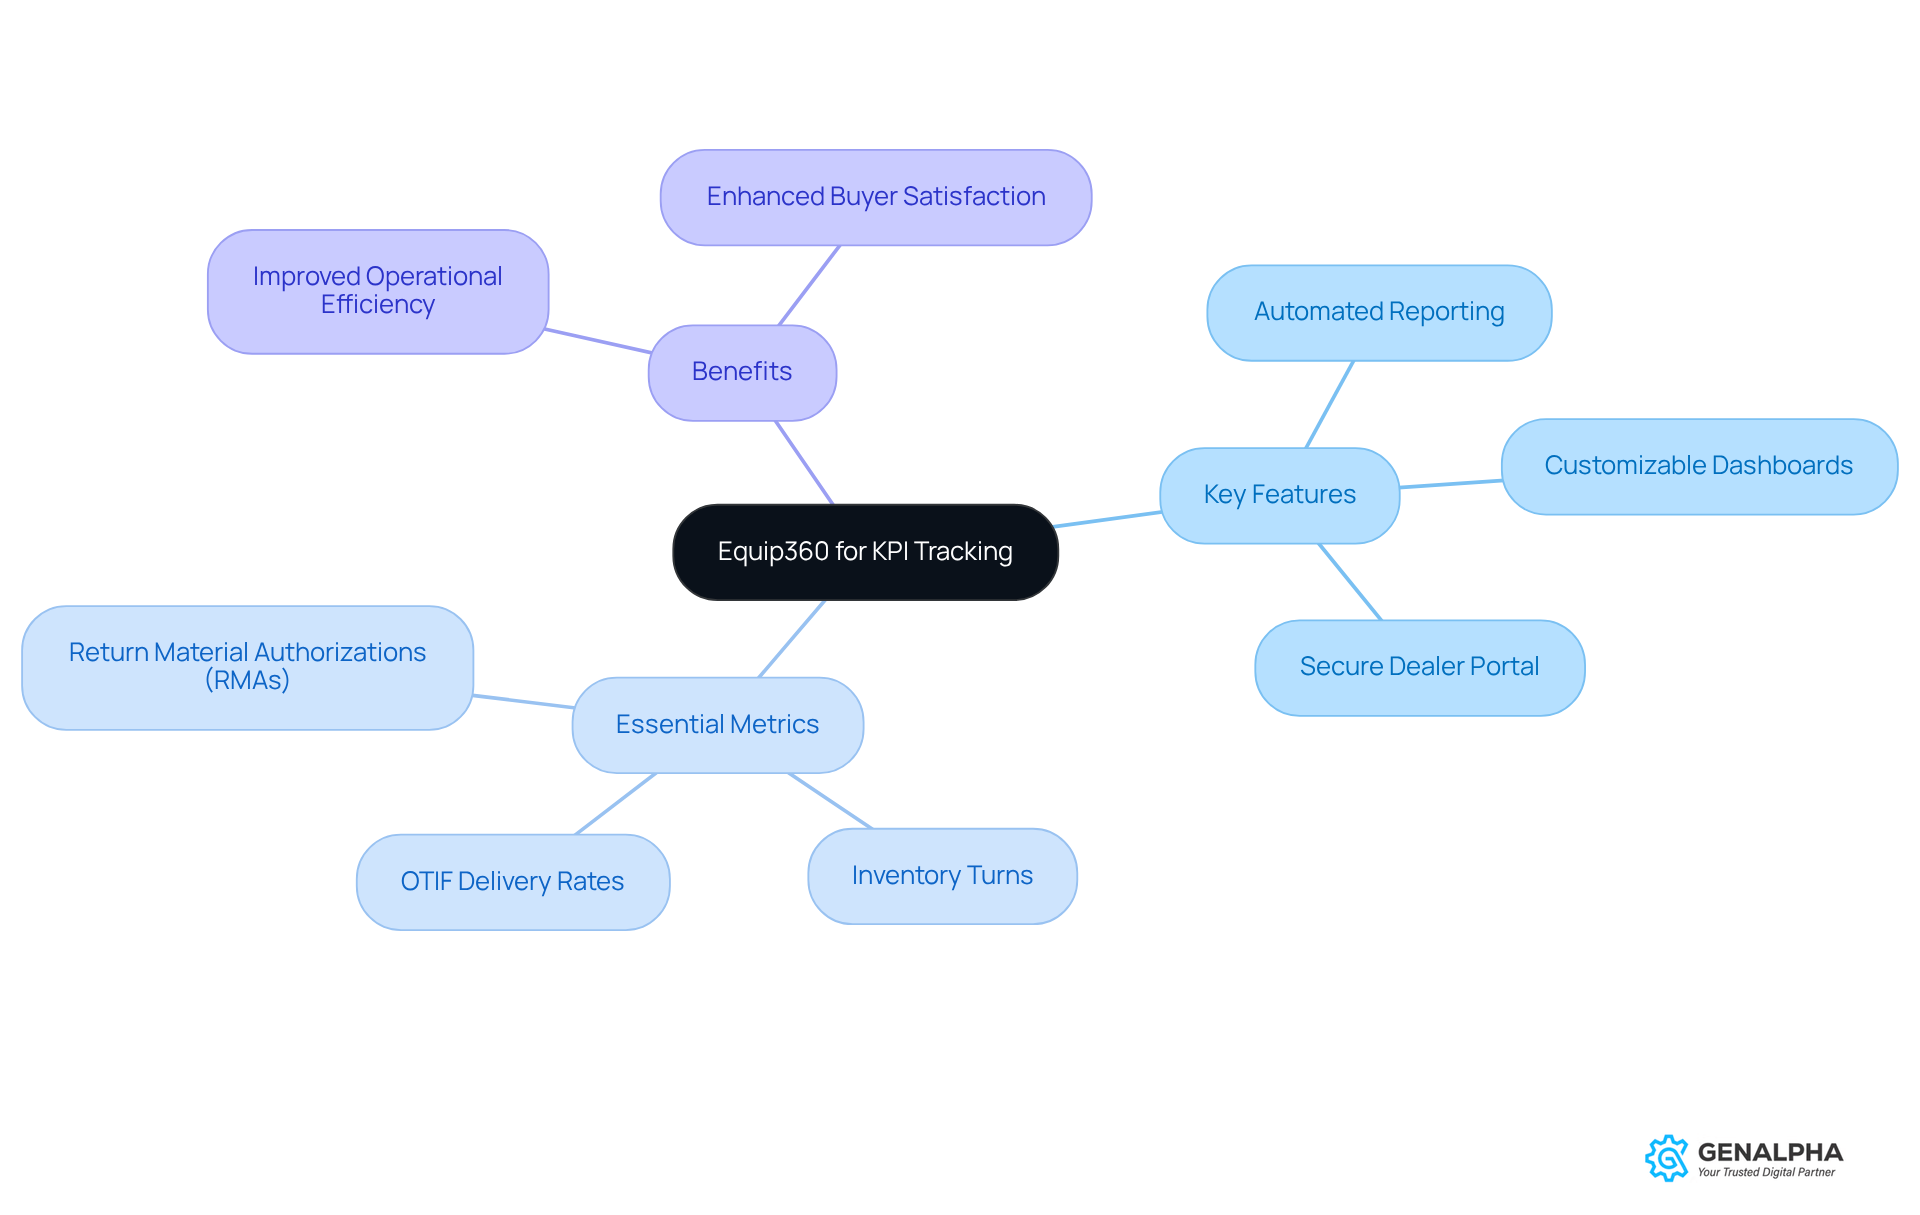
Ever felt overwhelmed trying to keep track of all those important metrics in your manufacturing business? GenAlpha Technologies presents the Equip360 platform, a robust digital solution designed just for equipment manufacturers and distributors. With Equip360, tracking those critical ecommerce KPIs becomes a breeze. You get real-time insights into inventory levels, pricing strategies, and how orders are managed. It makes keeping an eye on performance metrics easy and even improves how buyers interact with the purchasing process. Key features like automated reporting and customizable dashboards empower manufacturers to analyze ecommerce KPIs and make smart, data-driven decisions. This not only boosts operational efficiency but also improves buyer satisfaction.
The platform's capabilities extend to tracking essential metrics like:
- On-Time In-Full (OTIF) delivery rates, which measure the reliability of order fulfillment
- Inventory Turns, reflecting the effectiveness of inventory management
Additionally, Equip360 supports the analysis of Return Material Authorizations (RMAs) to gauge product quality and customer satisfaction. By leveraging these insights, manufacturers can identify areas for improvement and optimize their operations.
A secure dealer portal enhances dealer loyalty by providing private logins for dealers to view parts, start warranty claims, and access real-time information on pricing and order status. This feature streamlines business processes and fosters stronger relationships with dealers.
Want to see how Equip360 really makes a difference? Check out these case studies on KPI tracking in manufacturing. For example, organizations utilizing the platform have reported improved Overall Equipment Effectiveness (OEE) by monitoring machine downtime occurrences and implementing preventive maintenance strategies. This proactive approach not only reduces unscheduled downtime but also maximizes equipment utilization, leading to improved productivity.
In summary, Equip360 stands out as a comprehensive tool for tracking ecommerce KPIs in the manufacturing sector. Without Equip360, you might just be missing out on the insights that could take your operations to the next level.
Monitor Conversion Rate to Optimize Sales Performance
Have you ever wondered why some online stores seem to sell out while others struggle? Let’s discuss ecommerce kpis, particularly conversion rates, which indicate the percentage of visitors who actually proceed to make a purchase. Pretty important, right? For those in the equipment game, monitoring ecommerce kpis helps you see how well your marketing is working and how user-friendly your site is. By 2026, the average eCommerce conversion rate is around 2.74%. Even a small bump of 1-2% can mean millions more in your pocket!
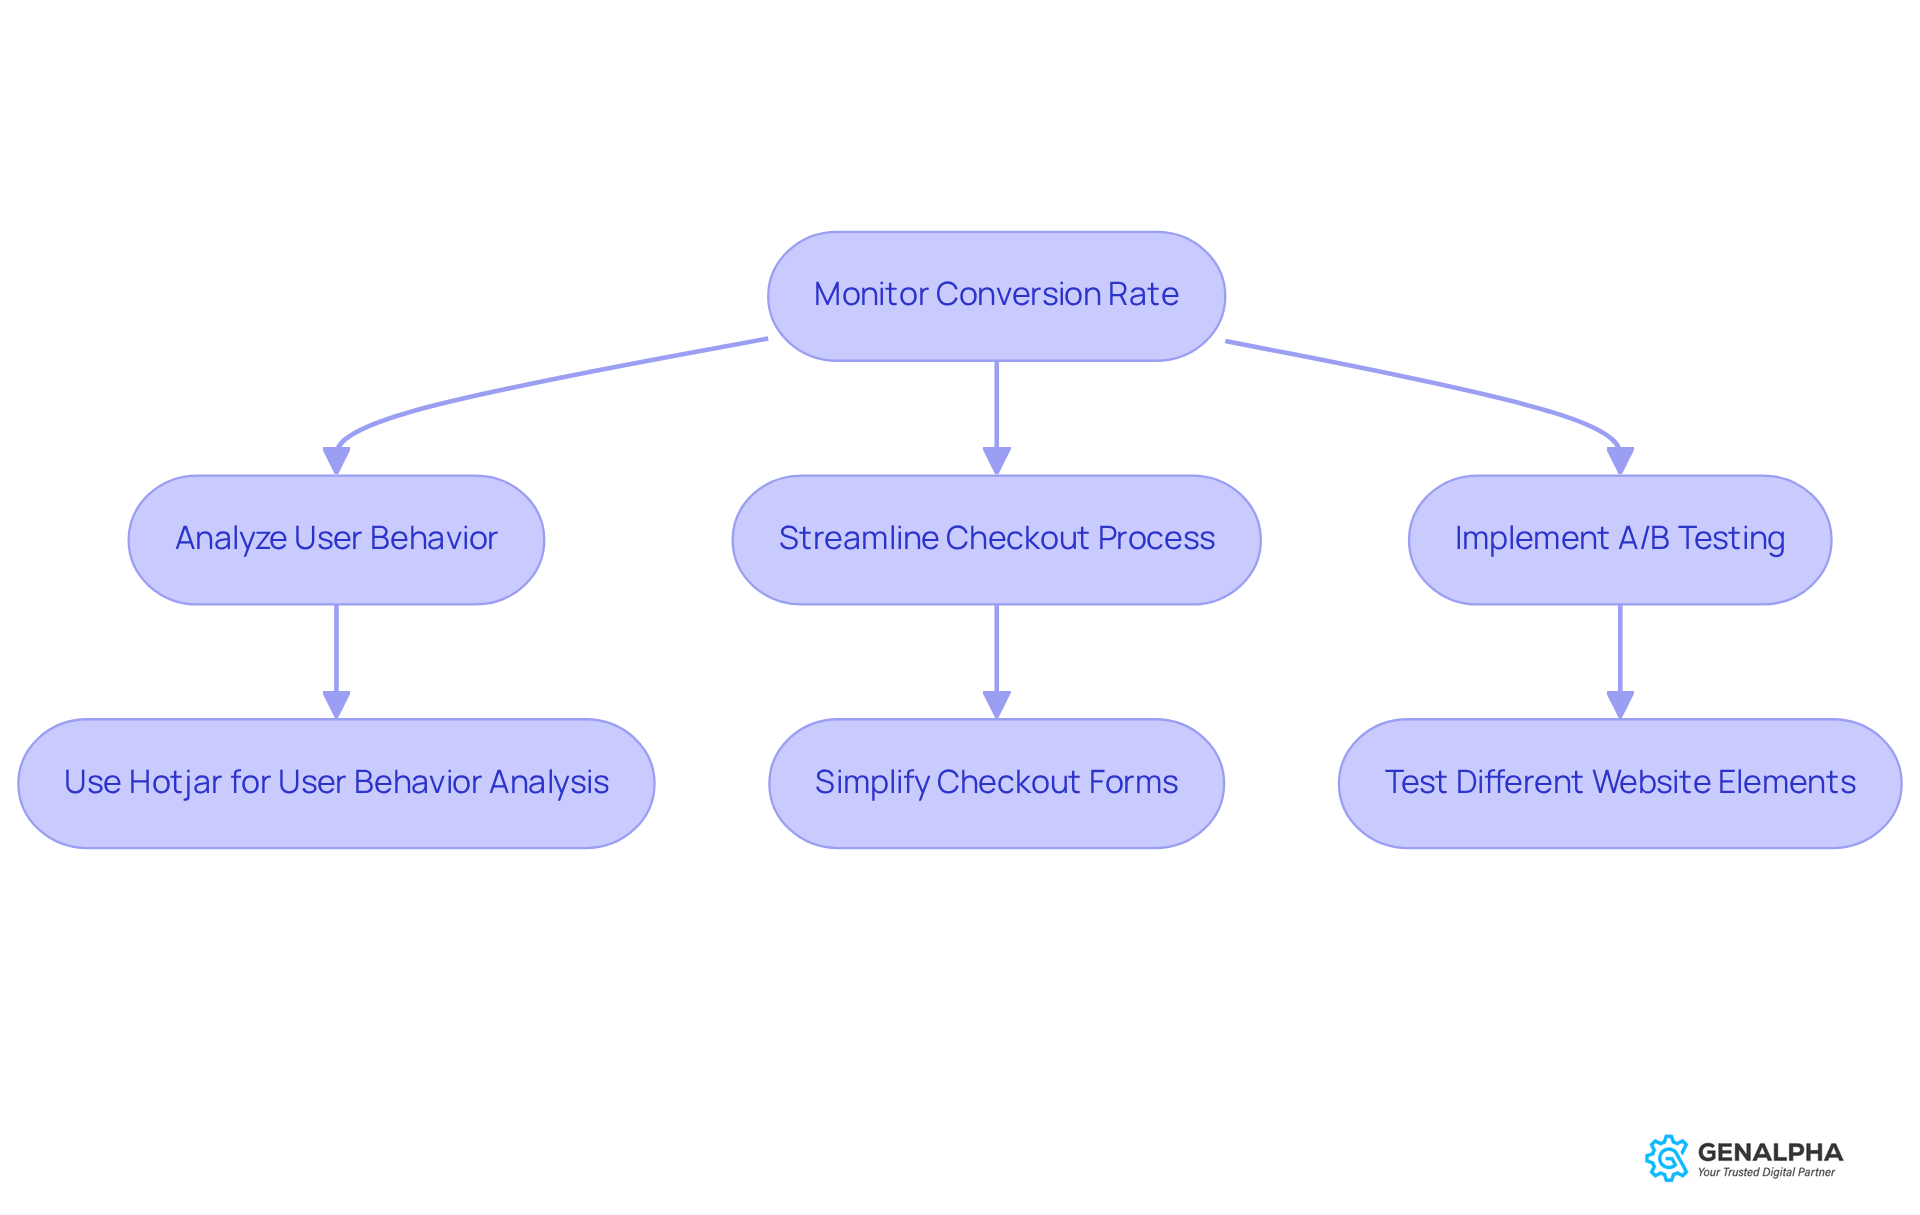
So, how can manufacturers boost those conversion rates? Here are a few friendly tips!
- Analyze User Behavior: Tools like Hotjar and VWO can help you spot where users drop off and how to make their experience better.
- Streamline the Checkout Process: Simplifying checkout forms by asking only for essential info can really cut down on friction. Case studies show that this approach can lead to improved ecommerce kpis, including better conversion rates. Plus, integrating payment gateways like Authorize.Net and Worldpay can make transactions smoother.
- Implement A/B Testing: Regularly testing different elements of your website, like CTAs and page layouts, helps you find what works best for your audience.
Additionally, leveraging GenAlpha's Equip360 platform can supercharge these efforts. Equip360 not only provides a robust eCommerce and analytics solution but also integrates seamlessly with existing ERP systems. This means real-time price visibility and order tracking, allowing you to respond quickly to inquiries about product availability and order status. It also helps reduce call volumes and boosts overall satisfaction. The modularity of Equip360 ensures that it can adapt to evolving client needs, making it a versatile tool for producers.
For instance, a case study involving Allied Van Lines showed that focusing on user experience rather than just increasing traffic led to a 9.44% increase in organic conversions over twelve months. This highlights the importance of refining existing traffic rather than solely seeking new visitors.
Keep an eye on the ecommerce kpis and tweak your strategies as needed. This way, you can stay ahead of the game and really connect with your customers!
Track Average Order Value to Enhance Revenue Insights
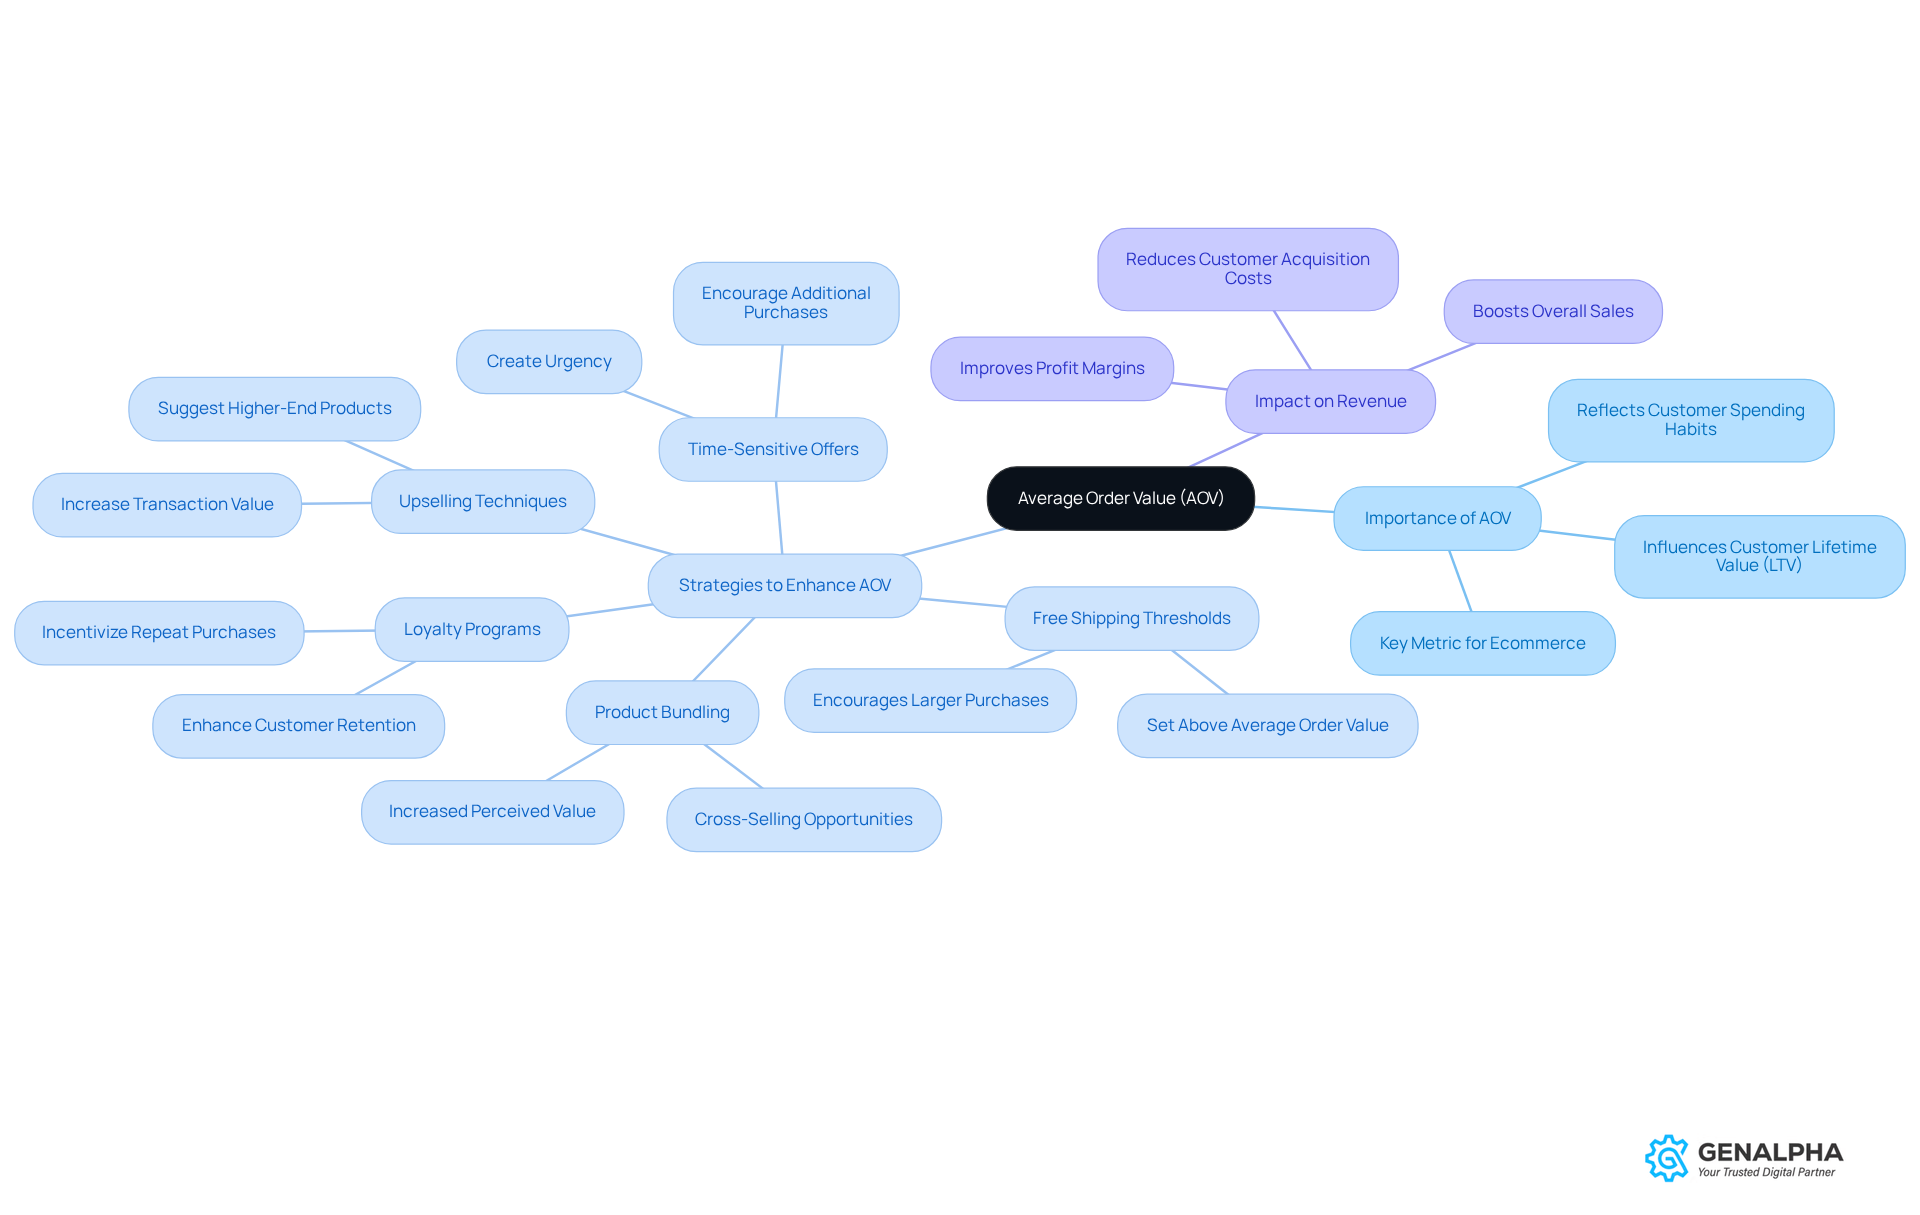
Have you ever wondered how much your average order value (AOV) really impacts your business? AOV is a critical metric for equipment manufacturers and is considered one of the key ecommerce KPIs, calculated by dividing total revenue by the number of orders. This figure not only reflects spending habits but also serves as a key indicator of ecommerce KPIs related to business performance. In the equipment manufacturing world, average order values usually sit between $500 and $1,000. This range is crucial for tracking trends and implementing strategies to encourage larger transactions.
For example, have you considered how product bundling could boost your AOV? Bundling complementary products can effectively cross-sell and enhance perceived value. One ecommerce store saw a notable increase in AOV by offering bundles of related items, making it easier for shoppers to decide. Additionally, setting strategic free shipping thresholds just above the average order value can motivate shoppers to add more items to their carts. Did you know that about 58% of people are willing to spend a little more to qualify for free shipping?
Taking a regular look at your ecommerce KPIs, including AOV, can provide insights that significantly boost your revenue and profits! By using customer data with Equip360 Analytics, you can personalize your marketing efforts and offer time-sensitive discounts, creating urgency and encouraging larger purchases. Equip360's analytics dashboards and real-time reporting capabilities help you effectively track ecommerce KPIs, including AOV trends, ensuring you stay competitive in the evolving landscape of 2026. Understanding AOV isn’t just about numbers; it’s about unlocking the potential for greater sales and a stronger competitive edge.
Evaluate Customer Acquisition Cost for Marketing Efficiency
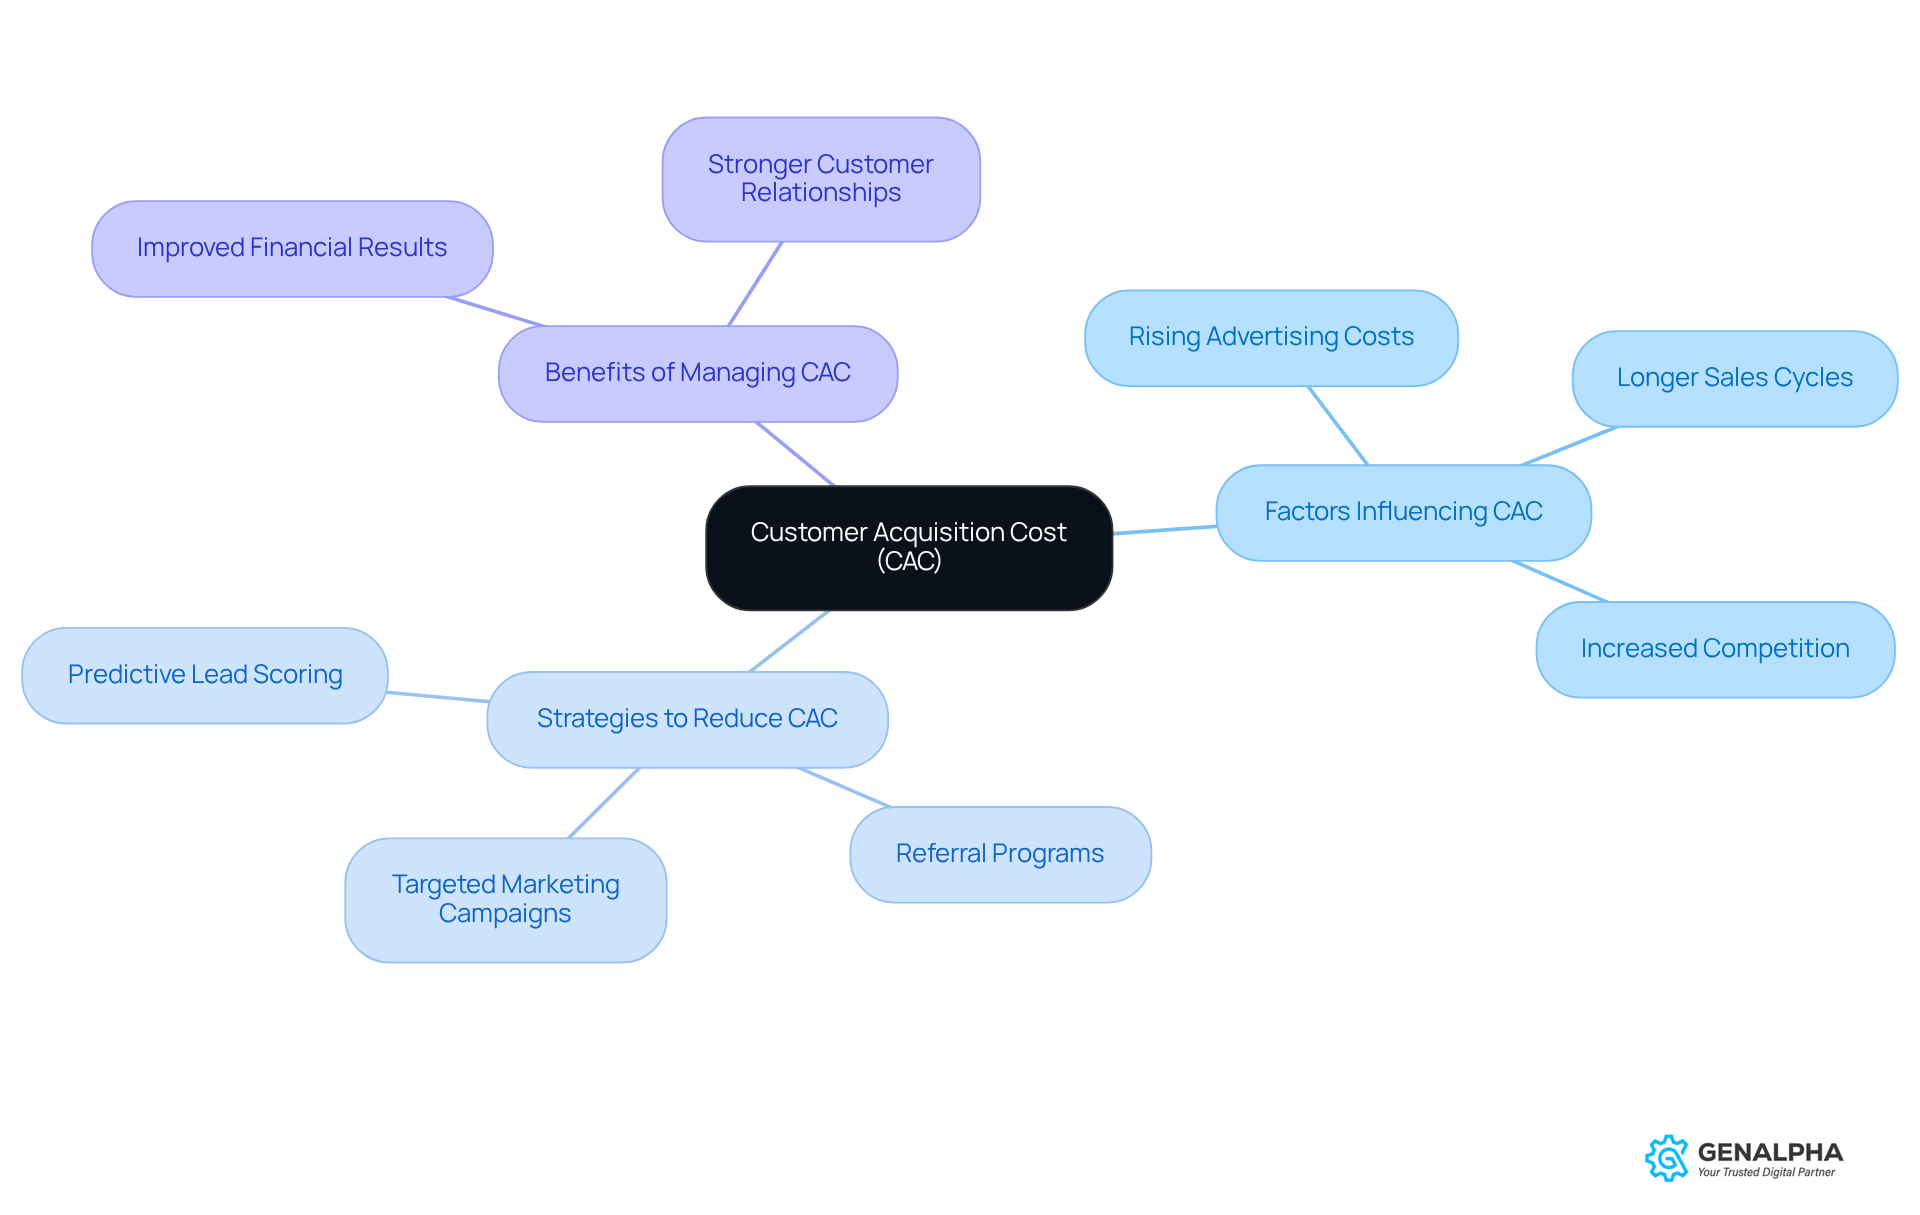
Have you ever wondered how much it really costs to bring a new customer on board? Customer acquisition cost (CAC) is a crucial metric for equipment producers, covering all the expenses involved in snagging a new client, from marketing to sales. By 2026, it’s expected that the average CAC for manufacturing companies will be around $270 to $300, which is quite a jump-over 60% more than just five years ago! This surge is mainly due to rising advertising costs, longer sales cycles, and increased competition.
Getting a grip on CAC is key to figuring out if your marketing efforts are paying off. By examining CAC, producers can pinpoint the most effective channels for attracting clients and tweak their strategies accordingly. For instance, companies that use advanced measurement techniques and data analytics, like those offered by GenAlpha's Equip360 platform, can fine-tune their outreach efforts. This leads to better engagement and a lower CAC.
With Equip360’s powerful analytics, you can spot engagement trends that really matter, helping producers make smart decisions about product offerings and marketing strategies. Plus, its integration with ERP systems provides real-time data insights, allowing manufacturers to optimize their marketing efforts effectively. Experts suggest that targeted marketing campaigns, improved client experiences, and AI-driven tools can significantly cut down CAC. For example, businesses using predictive lead scoring have seen a 30% to 40% reduction in sales development representative (SDR) cycles on poor-fit leads, letting teams focus on high-potential prospects.
Case studies show successful strategies for lowering CAC in the manufacturing sector. One effective approach is to optimize high-CAC campaigns and boost referral programs, which can lead to significant reductions in acquisition costs in just a few weeks. Additionally, shifting to lifetime value (CLV) models helps producers build long-term relationships with clients, ultimately lowering CAC through repeat purchases and increased loyalty.
In summary, keeping a close eye on CAC is vital for equipment producers looking to enhance marketing efficiency and drive sustainable growth. By consistently tracking CAC and using focused strategies, businesses can improve their acquisition processes and achieve better financial results. By mastering CAC, you can not only save money but also build stronger relationships with your customers.
Assess Customer Lifetime Value for Long-Term Profitability
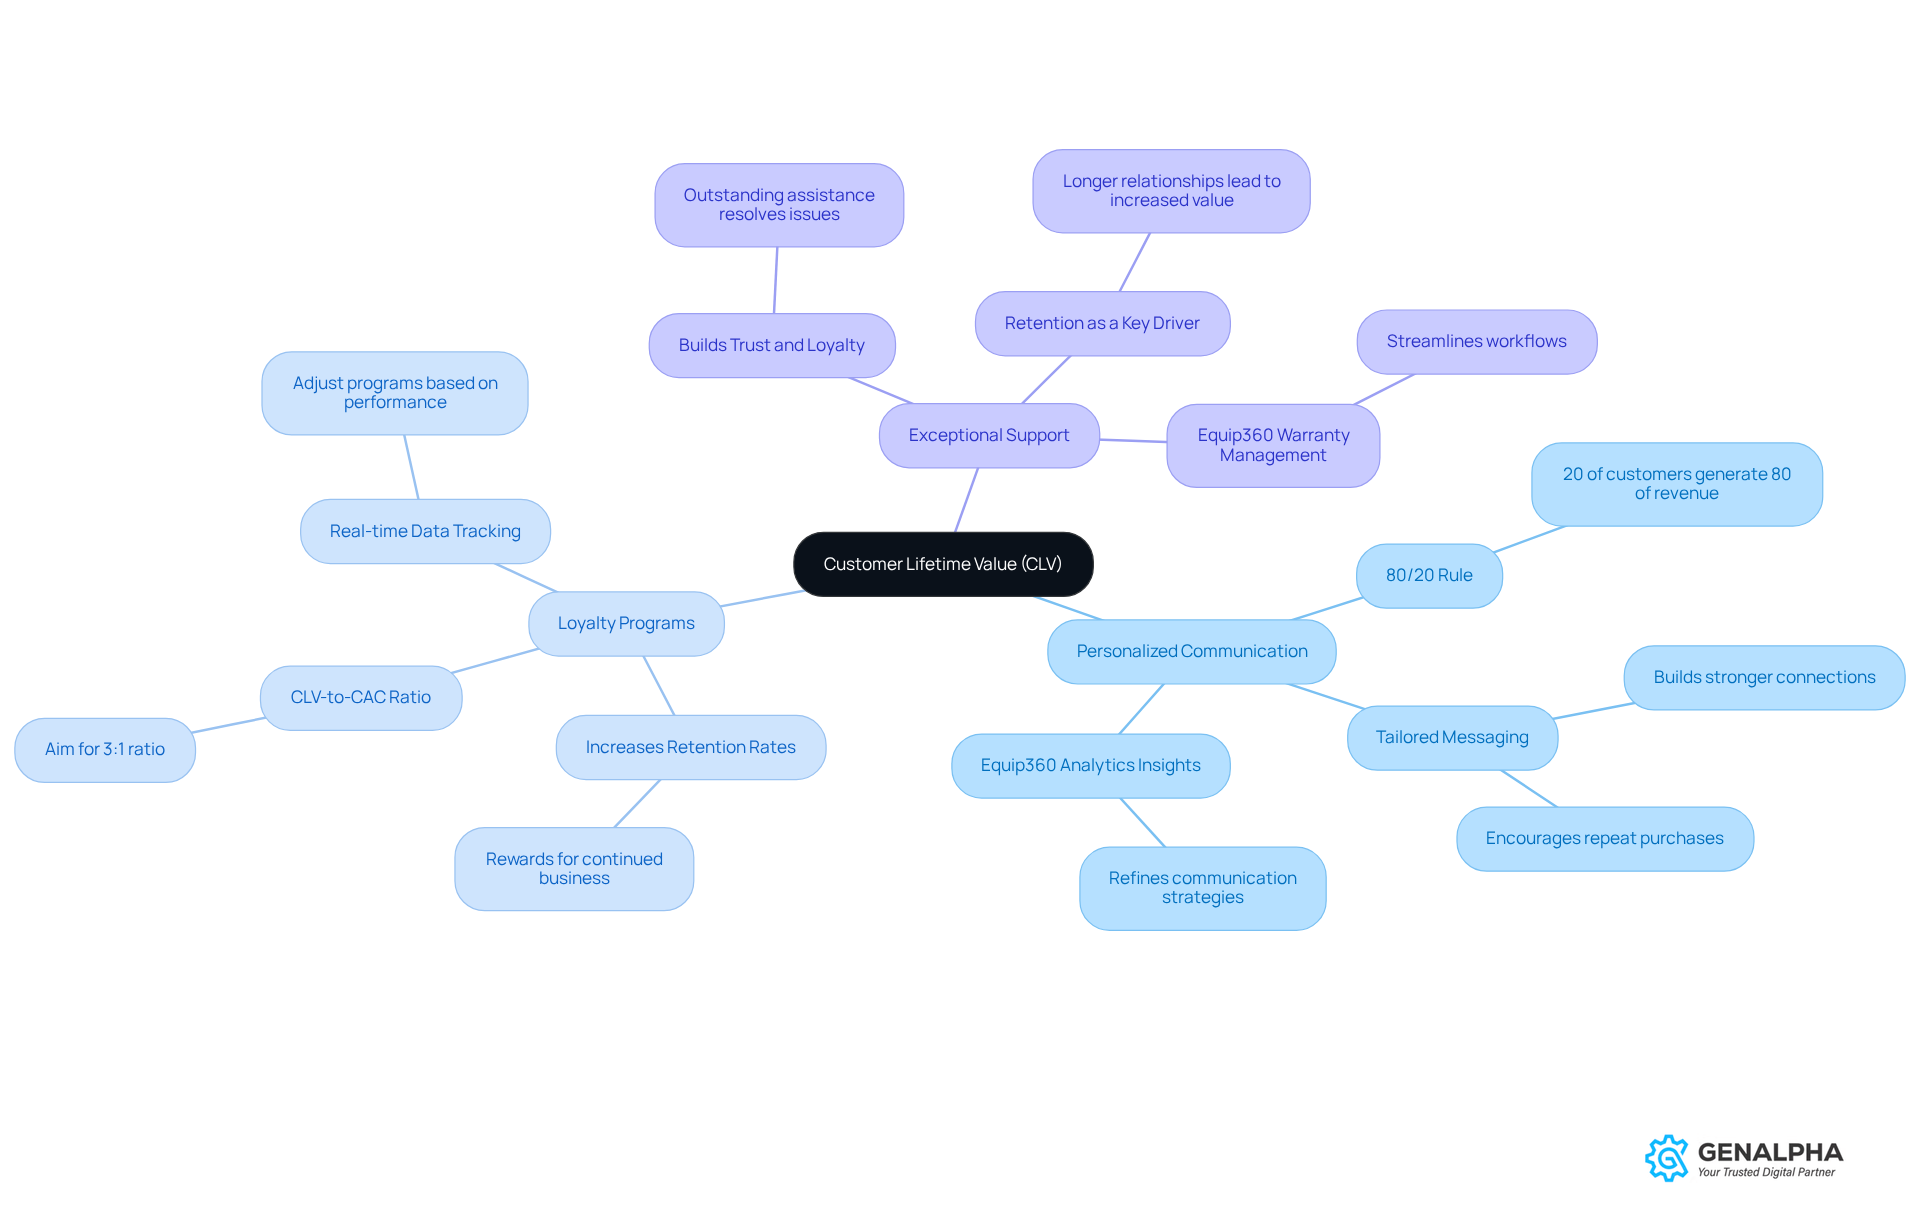
Ever wondered how much a single customer is worth to your business over time? Customer Lifetime Value (CLV) is a key metric that helps equipment producers estimate the total revenue they can expect from a client throughout their relationship. Understanding CLV is crucial for manufacturers aiming to create long-term strategies focused on retention and loyalty. By analyzing CLV, businesses can pinpoint high-value clients and tailor their marketing efforts to boost satisfaction and engagement.
In 2026, effective strategies to enhance CLV include:
- Personalized Communication: Did you know that a small group of your customers-just 20%-can actually bring in 80% of your revenue? Tailoring messages based on customer preferences and behaviors helps build stronger connections and encourages repeat purchases. Equip360 Analytics offers insights into engagement patterns, enabling manufacturers to refine their communication strategies effectively.
- Loyalty Programs: Implementing programs that reward clients for their continued business can significantly increase retention rates. A good CLV-to-CAC ratio is 3:1, meaning for every dollar spent on acquiring a customer, you should aim to get at least three dollars back in profit. Equip360's analytics capabilities can help track how well these programs are working and adjust them based on real-time data.
- Exceptional Support: Providing outstanding assistance not only resolves issues but also builds trust and loyalty among clients. Retention is recognized as the most significant factor influencing CLV, as longer relationships with clients lead to increased purchase frequency and total value. Equip360's warranty and RMA management features streamline workflows, enhancing client satisfaction and support.
Case studies show how effective these approaches can be. For instance, a producer that embraced hyper-personalization saw a boost in loyalty and engagement from clients, leading to a significant rise in CLV. Plus, data-driven aftersales strategies, backed by Equip360 Analytics, have proven essential for adapting to market changes and improving client satisfaction. The integration of IoT and predictive analytics has allowed producers to proactively address client needs, further solidifying relationships.
Expert insights highlight that concentrating on CLV enables producers to prioritize high-value segments, ultimately enhancing profitability. When you truly understand CLV, you’re not just crunching numbers; you’re building a foundation for lasting success.
Analyze Cart Abandonment Rate to Improve Checkout Success
Have you ever added items to your cart only to abandon them at checkout? It’s a common scenario, and for equipment suppliers, it’s a big deal. Did you know that around 70% of online shoppers leave their carts behind? This is especially true in the manufacturing sector, where challenges abound. A high cart abandonment rate often points to issues in the checkout process or concerns about pricing.
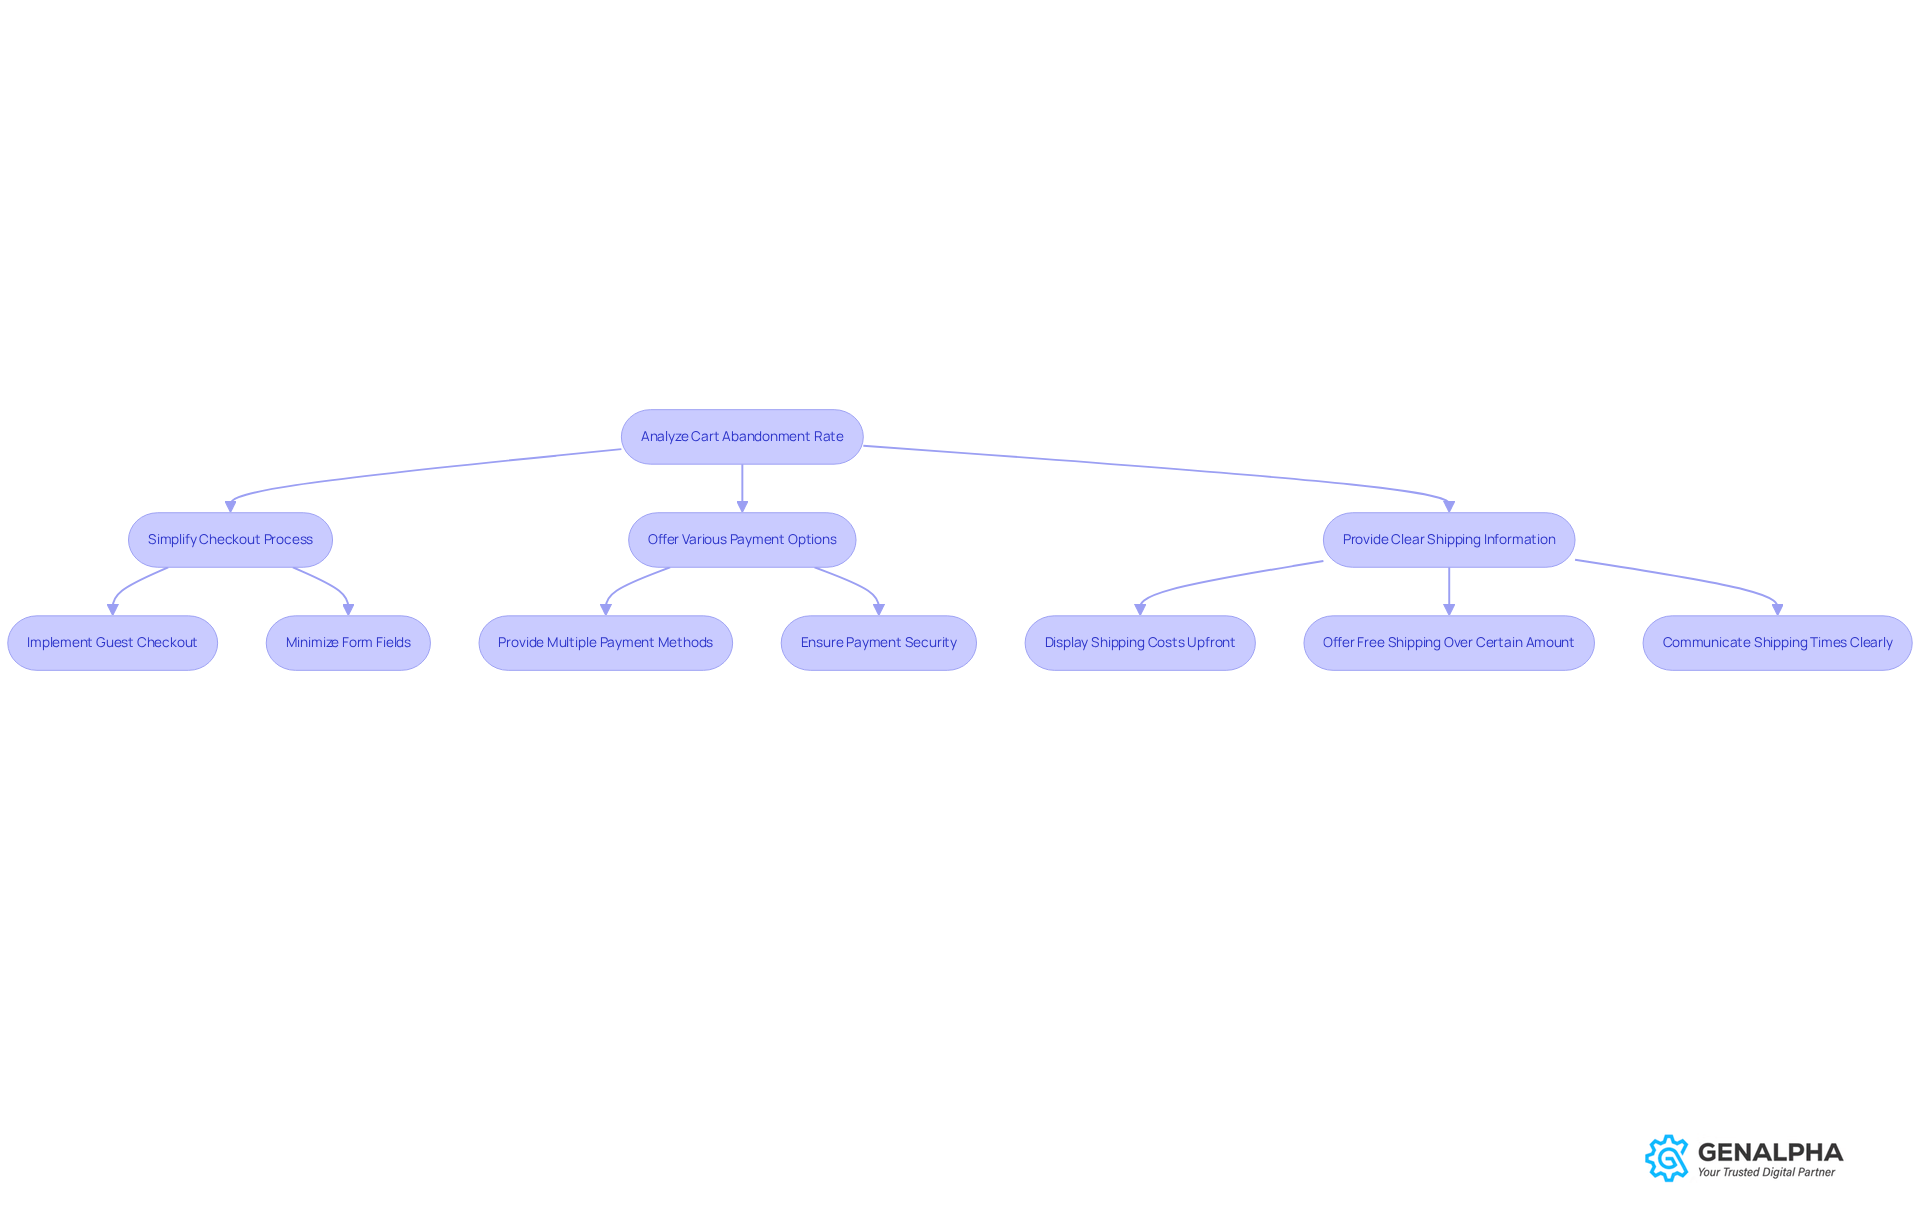
So, what can manufacturers do about this? First, take a close look at your ecommerce KPIs, particularly the cart abandonment stats, to spot what’s causing those lost sales. Strategies like:
- Simplifying the checkout process
- Offering various payment options
- Providing clear shipping information
can really enhance the user experience and help reduce those abandonment rates. For instance, did you know that 28% of lost sales are due to requiring account creation before purchase? Implementing guest checkout options could be a game changer.
Additionally, leveraging Equip360's unique identifier search feature allows users to quickly find the right components, making parts identification and ordering a breeze. Case studies show that these strategies work. One retailer improved their cart recovery by enhancing their returns policy, which exceeded legal requirements, boosting customer trust and engagement. Another retailer focused on optimizing website performance and found that resolving technical issues led to lower abandonment levels.
By taking these steps, you can turn those abandoned carts into completed sales, boosting your bottom line in no time!
Measure Repeat Purchase Rate to Foster Customer Loyalty
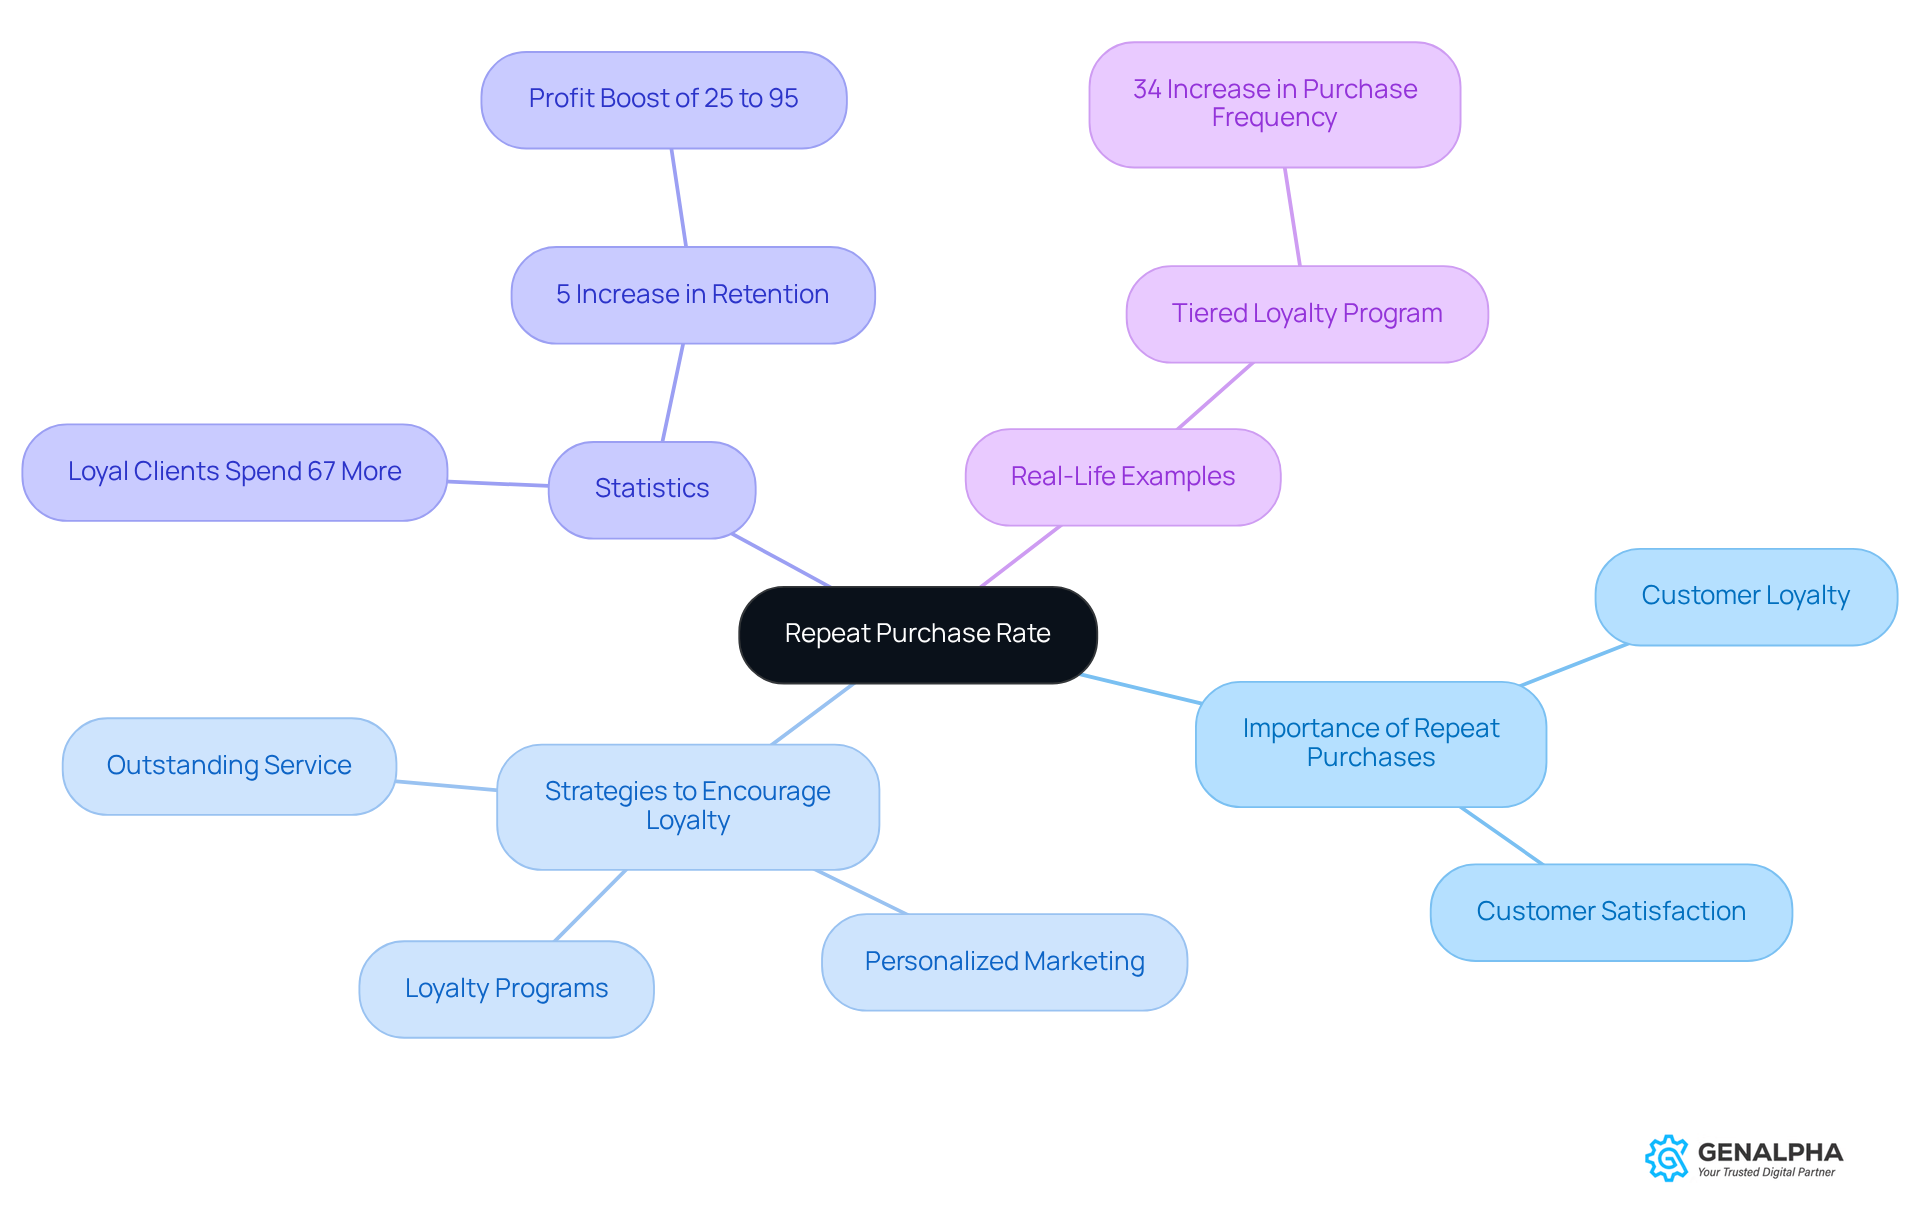
Have you ever thought about what keeps customers coming back for more? The repeat purchase metric is a vital indicator that shows how many people make multiple transactions with a business. For equipment manufacturers, this number is a crucial sign of loyalty and satisfaction among clients. When businesses keep an eye on their repeat purchase rate, they can spot trends and come up with strategies to encourage customers to return. This might include loyalty programs, personalized marketing, or simply providing outstanding service.
Did you know that just a 5% bump in keeping your clients can boost profits by 25% to 95%? That's huge! Plus, loyal clients tend to spend 67% more than new ones, which really highlights the importance of nurturing these relationships.
Let’s look at some real-life examples of how companies in the equipment manufacturing sector have nailed it. A leading manufacturer rolled out a tiered loyalty program that rewarded customers for repeat purchases, leading to a 34% increase in purchase frequency. This approach not only improved engagement but also strengthened long-term relationships.
Experts say that to really get a handle on repeat purchases, you need to pay attention to client feedback and ecommerce KPIs related to engagement metrics. By utilizing Equip360 Analytics, producers can customize their offerings to meet client needs, ultimately driving higher repeat purchases. Additionally, integrating client portals can enhance the experience by providing easy access to information and support, which is vital for nurturing loyalty. As we look ahead to 2026, understanding repeat purchase rates could be the key to unlocking your business's growth potential.
Calculate Return on Investment for Strategic Decision-Making
Ever wondered how to truly measure the success of your investments? Return on investment (ROI) is a vital metric that helps you assess how profitable your investment is compared to its cost, especially if you're in the equipment production game. Getting ROI right is key to figuring out if your marketing campaigns, product launches, and operational changes are hitting the mark. By analyzing ROI, you can make informed decisions about where to allocate resources and spot which strategies are really paying off.
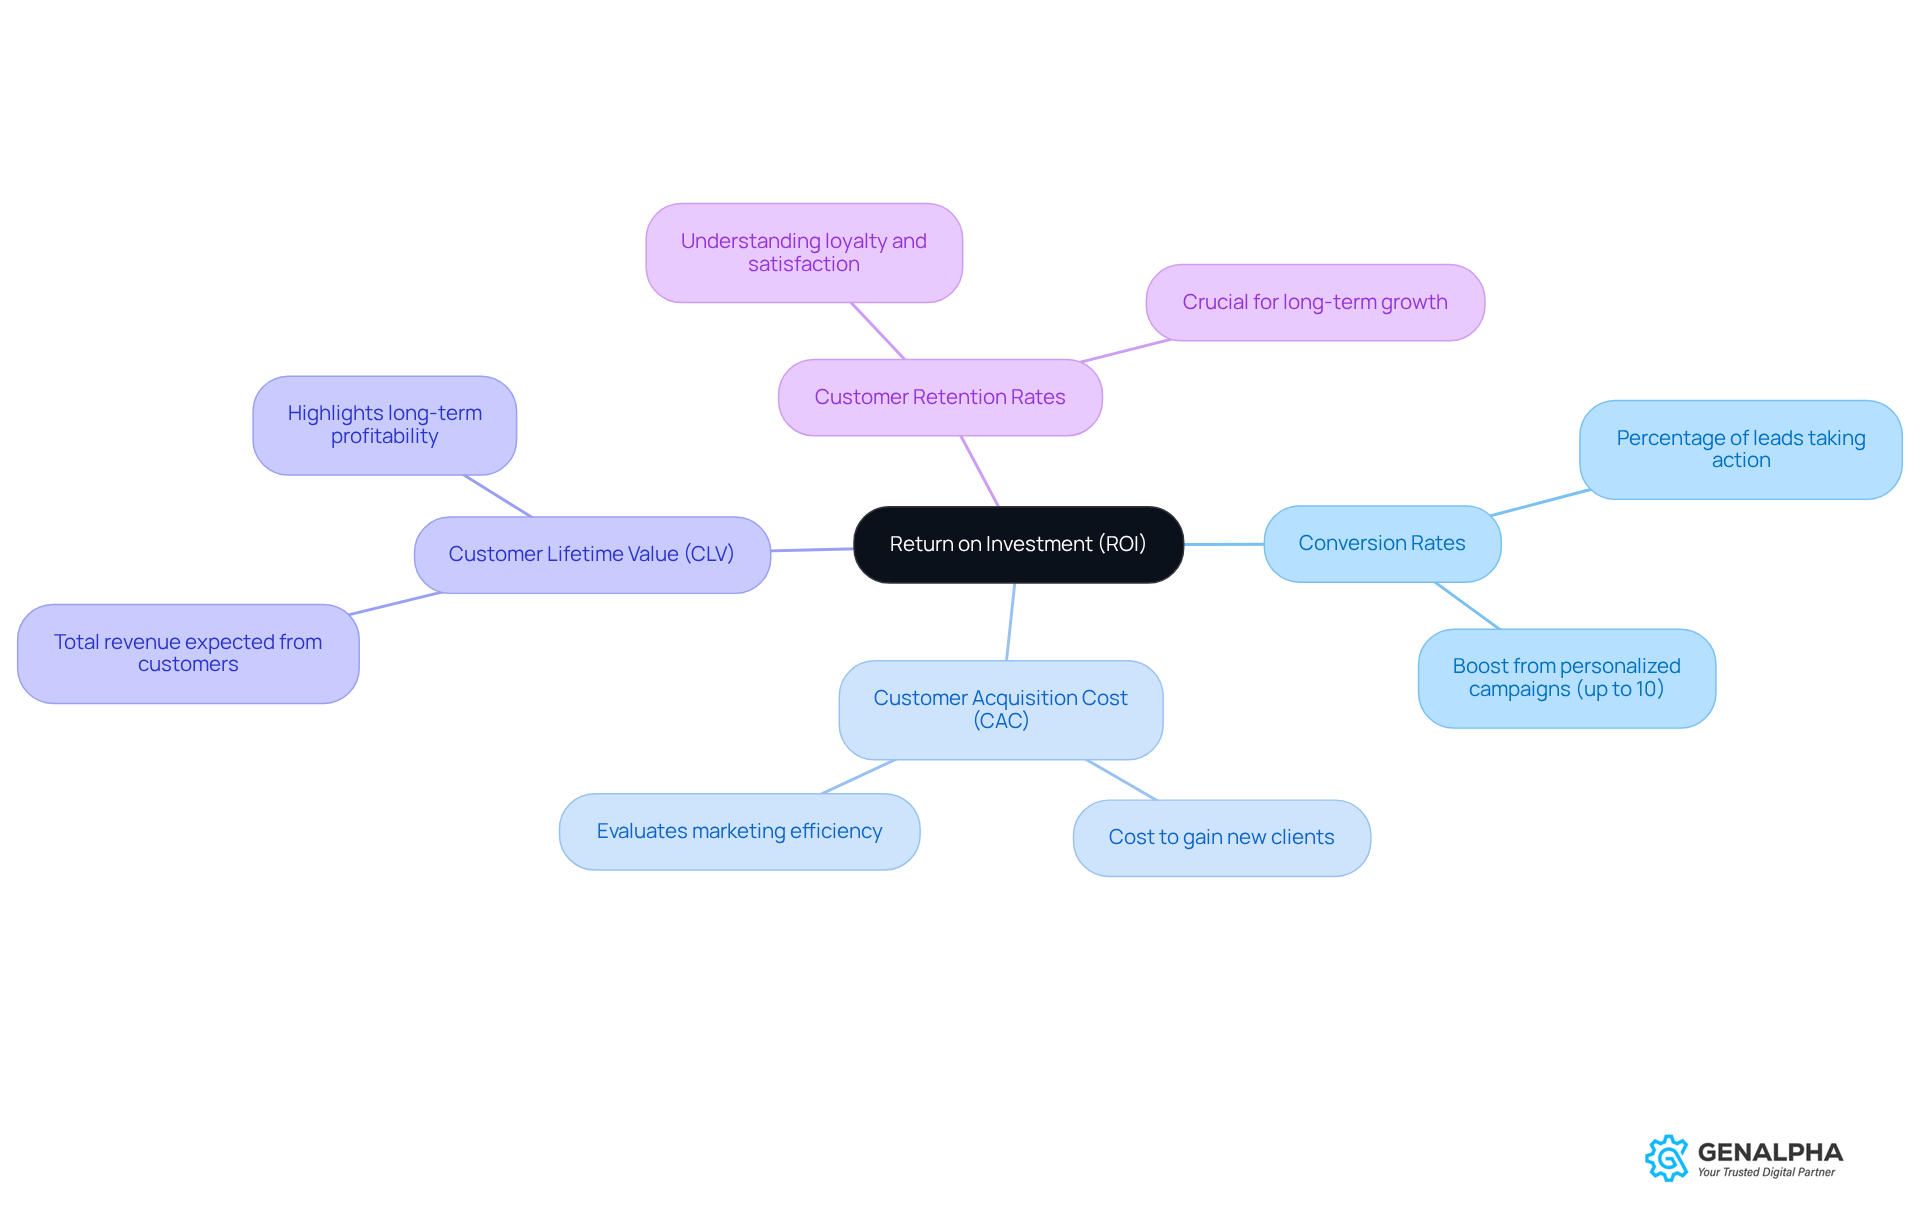
To effectively calculate ROI, manufacturers should focus on several key metrics:
- Conversion Rates: This shows the percentage of leads that take desired actions, giving you a clear picture of your marketing effectiveness.
- Customer Acquisition Cost (CAC): Knowing how much you spend to gain new clients helps you evaluate your marketing efficiency.
- Customer Lifetime Value (CLV): This estimates the total revenue you can expect from customers over time, highlighting long-term profitability.
- Customer Retention Rates: Keeping an eye on this metric is crucial for understanding loyalty and satisfaction levels.
Regularly checking these metrics allows you to optimize your investments and drive long-term growth. For example, case studies have shown that businesses implementing personalized email campaigns can boost conversion rates by up to 10%. Plus, effective marketing automation can yield an impressive average ROI of $5.44 for every dollar spent, especially in manufacturing campaigns.
So, by keeping these metrics in mind and tweaking your strategies, you can really boost your marketing game and thrive in this competitive world!
Utilize Net Promoter Score to Gauge Customer Satisfaction
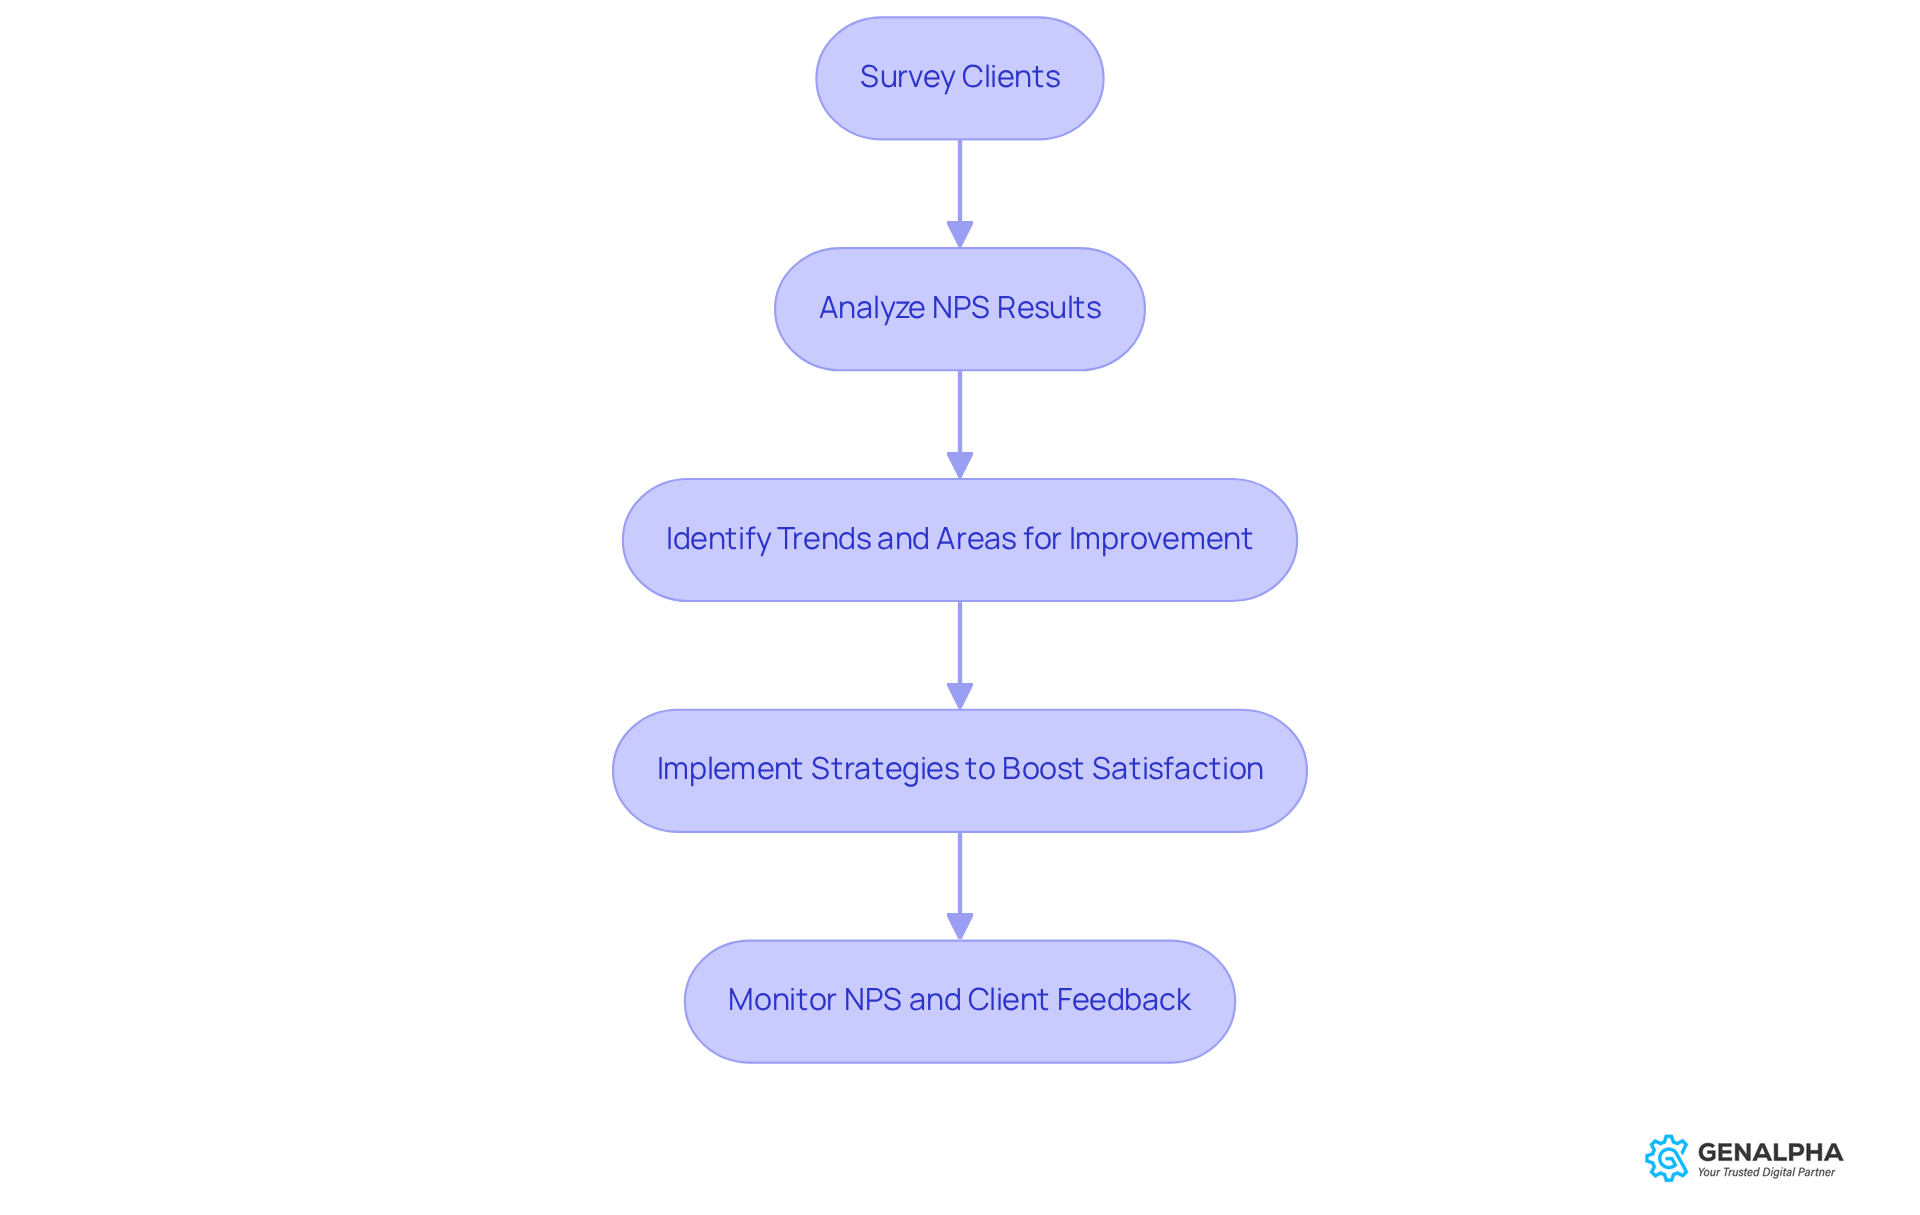
Have you ever wondered how loyal your clients really are? The Net Promoter Score (NPS) is a key metric for equipment producers, helping them gauge loyalty and satisfaction based on how likely clients are to recommend their business. Using NPS helps producers understand how clients feel and where they can improve. Regularly surveying clients and analyzing NPS results allows businesses to spot trends and implement effective strategies to boost satisfaction.
In 2026, a strong NPS for equipment manufacturers is considered 49, which indicates a solid client base. When your NPS is high, it shows your clients are loyal and more likely to refer you to others. Companies like Airbnb have successfully used NPS feedback to refine their experience, proving how powerful this metric can be in driving significant improvements in satisfaction.
But here’s the catch: sustaining a high NPS requires ongoing efforts in engagement and service improvement. If you don’t stay responsive, you risk losing loyal clients. That’s why producers must be quick and adaptable to changing client needs to maintain or elevate their NPS in a competitive landscape.
With GenAlpha's Equip360 platform, producers can tap into advanced analytics and real-time reporting capabilities, including seamless ERP integration, to gain deeper insights into client engagement and satisfaction trends. Equip360's segmentation features allow producers to tailor their approaches effectively, ensuring they meet client needs and expectations, ultimately driving higher NPS scores. Testimonials from clients like Gradall Industries and Patterson Equipment further illustrate the positive impact of Equip360 on customer satisfaction. Staying ahead means not just listening but acting on what your clients are saying.
Track Revenue Per Visitor to Optimize Online Performance
Ever wondered how much each visitor to your website is really worth? Revenue per visitor (RPV) is a key metric that helps you understand just that. For those in the equipment business, keeping an eye on RPV is key to figuring out how well your online marketing is working. By 2026, knowing how much each visitor brings in could really boost your profits in manufacturing eCommerce. Analyzing RPV helps businesses see which marketing efforts pay off and how to make their websites more user-friendly.
To enhance RPV, manufacturers can implement several strategies:
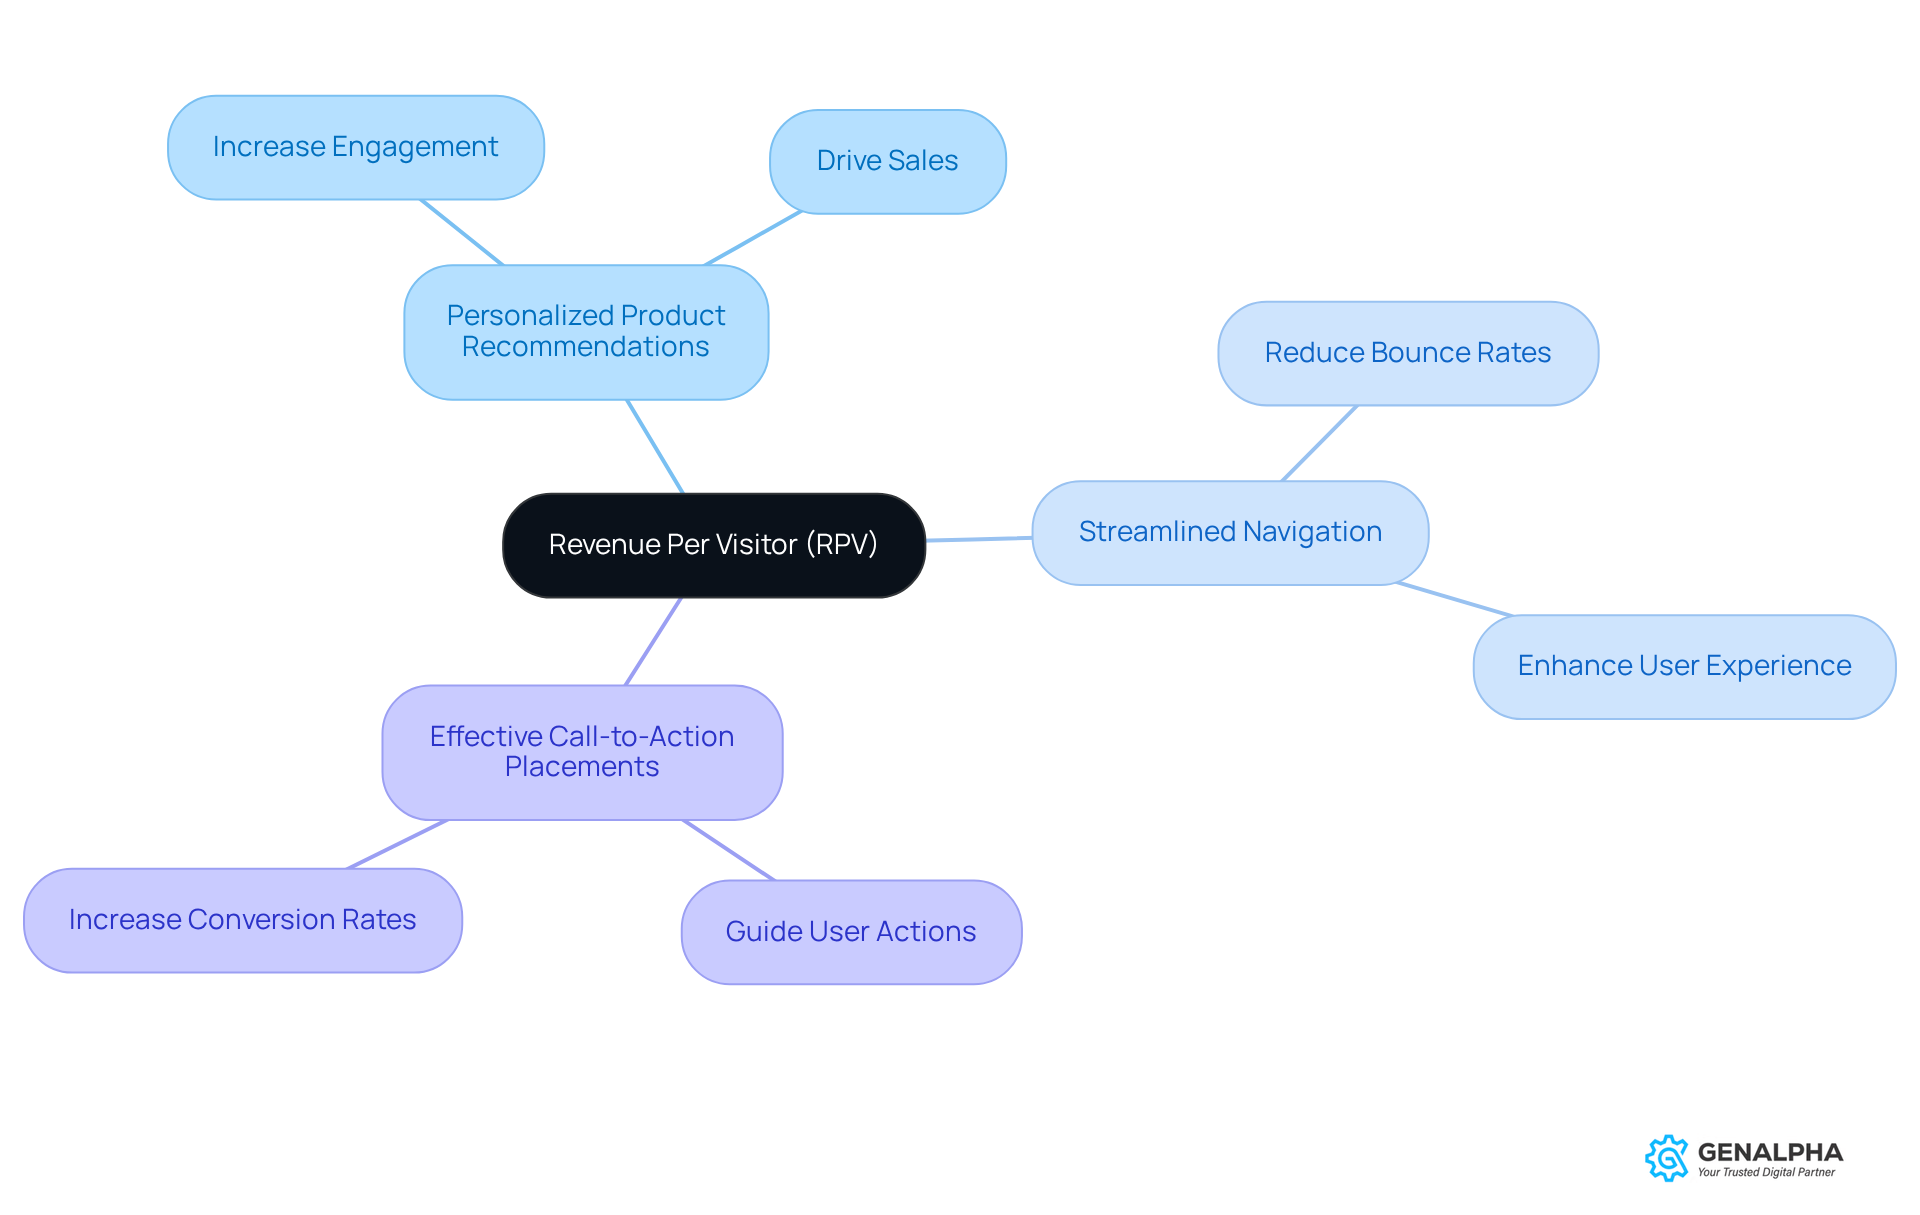
- Personalized Product Recommendations: Tailoring suggestions based on user behavior can increase engagement and drive sales.
- Streamlined Navigation: Ensuring that visitors can easily find products and information reduces bounce occurrences and encourages purchases.
- Effective Call-to-Action Placements: Strategically positioning CTAs can guide users toward desired actions, such as requesting quotes or making purchases.
Case studies have shown that companies focusing on these optimization strategies have seen substantial improvements in their RPV. For example, businesses that implemented optimized prospect capture forms reported conversion figures soaring by up to 30%. Additionally, a well-crafted landing page can enhance conversion rates by as much as 25%, showing the direct link between user experience improvements and revenue generation.
Experts agree that really getting RPV can help you track your online success and shape your marketing plans, ensuring that equipment manufacturers stay competitive in a rapidly evolving digital landscape. Understanding RPV could be the game-changer that sets your business apart in the competitive online marketplace.
Conclusion
Are you keeping an eye on the right ecommerce KPIs to stay ahead in the game? Understanding and tracking these metrics is crucial for equipment manufacturers looking to thrive in a competitive landscape. This article shows why metrics like conversion rates, average order value, customer acquisition cost, and customer lifetime value matter. By using tools like GenAlpha's Equip360, manufacturers can get real-time visibility into these critical metrics, helping them make informed decisions that boost operational efficiency and customer satisfaction.
Key points include:
- The need to monitor conversion rates to optimize sales performance
- How average order value impacts revenue
- Why customer acquisition cost is essential for evaluating marketing effectiveness
- The importance of repeat purchase rates and net promoter scores for building customer loyalty and satisfaction
Each of these metrics plays a key role in a manufacturer’s strategy to drive growth and profitability.
So, tracking and analyzing ecommerce KPIs isn’t just about tech; it’s about strategy. By embracing the capabilities of Equip360 and focusing on these essential metrics, businesses can unlock new opportunities for improvement and success. Those who embrace data-driven insights will not just survive but thrive in the evolving landscape of manufacturing ecommerce.
Frequently Asked Questions
What is Equip360 and who is it designed for?
Equip360 is a robust digital solution developed by GenAlpha Technologies specifically for equipment manufacturers and distributors. It helps track critical ecommerce KPIs and provides real-time insights into inventory levels, pricing strategies, and order management.
What are some key features of Equip360?
Key features of Equip360 include automated reporting, customizable dashboards, tracking of On-Time In-Full (OTIF) delivery rates, Inventory Turns, and analysis of Return Material Authorizations (RMAs). These features empower manufacturers to analyze ecommerce KPIs and make data-driven decisions.
How does Equip360 enhance dealer relationships?
Equip360 includes a secure dealer portal that provides private logins for dealers to view parts, start warranty claims, and access real-time information on pricing and order status. This feature streamlines business processes and fosters stronger relationships with dealers.
How can Equip360 improve Overall Equipment Effectiveness (OEE)?
Organizations using Equip360 have reported improved OEE by monitoring machine downtime occurrences and implementing preventive maintenance strategies, which reduces unscheduled downtime and maximizes equipment utilization.
What is the significance of monitoring conversion rates in ecommerce?
Monitoring conversion rates is crucial as it indicates the percentage of visitors who make a purchase. For equipment manufacturers, it helps assess the effectiveness of marketing efforts and the user-friendliness of their website.
What strategies can manufacturers use to boost conversion rates?
Manufacturers can boost conversion rates by analyzing user behavior, streamlining the checkout process, and implementing A/B testing to find the most effective website elements.
How does Equip360 support sales performance?
Equip360 provides a robust eCommerce and analytics solution that integrates with existing ERP systems, offering real-time price visibility and order tracking, which helps reduce call volumes and improve overall customer satisfaction.
What is Average Order Value (AOV) and why is it important?
Average Order Value (AOV) is calculated by dividing total revenue by the number of orders. It reflects spending habits and serves as a key indicator of business performance, particularly in the equipment manufacturing sector.
How can manufacturers increase their Average Order Value?
Manufacturers can increase AOV by implementing product bundling, setting strategic free shipping thresholds, and using customer data to personalize marketing efforts and offer time-sensitive discounts.
How does Equip360 help track Average Order Value trends?
Equip360's analytics dashboards and real-time reporting capabilities allow manufacturers to effectively track AOV trends, helping them stay competitive and unlock potential for greater sales.
List of Sources
- GenAlpha Technologies: Equip360 for KPI Tracking
- Manufacturing KPI & Equipment Performance Template | DataFlip (https://community.fabric.microsoft.com/t5/Data-Stories-Gallery/Manufacturing-KPI-amp-Equipment-Performance-Template-DataFlip/td-p/5258500)
- 40+ Manufacturing KPIs and Metrics for Reporting in 2025 (https://insightsoftware.com/blog/30-manufacturing-kpis-and-metric-examples)
- 78 Essential Manufacturing Metrics and KPIs to Guide Your Industrial Transformation (https://netsuite.com/portal/resource/articles/erp/manufacturing-kpis-metrics.shtml)
- Gen Alpha and Kris Harrington Are Reimagining Aftermarket Digital Experiences — techcomm.news (https://techcomm.news/welcome/gen-alpha-and-kris-harrington-are-reimagining-aftermarket-digital-experiences)
- Monitor Conversion Rate to Optimize Sales Performance
- eCommerce conversion rate benchmarks by industry (https://marketing.dynamicyield.com/benchmarks/conversion-rate)
- CRO Statistics for 2026: What the Data Says About Conversions (https://designrush.com/agency/conversion-optimization/trends/cro-statistics)
- Conversion Rate Optimization for Manufacturing (https://workshopdigital.com/blog/conversion-rate-optimization-for-manufacturing)
- Conversion Rate Benchmarks 2026: Industry and Channel Data (https://digitalapplied.com/blog/conversion-rate-benchmarks-2026-industry-channel)
- Track Average Order Value to Enhance Revenue Insights
- How to Increase Average Order Value (AOV): 28 Tactics | NewStore (https://newstore.com/articles/how-to-increase-aov)
- 16 ways to increase average order value (https://paddle.com/resources/increase-average-order-value)
- 9 Ways to Increase Average Order Value (AOV) (https://shipmonk.com/resources/content-hub/average-order-value-9-ways-to-increase-average-order-value-increase-ecommerce-revenue-aov)
- Increase average order value: 17 proven tactics you can try right now (https://rebuyengine.com/blog/how-to-increase-average-order-value)
- 10 proven ways to increase average order value for ecommerce growth | Kard (https://getkard.com/blog/10-proven-ways-to-increase-average-order-value-for-ecommerce-growth)
- Evaluate Customer Acquisition Cost for Marketing Efficiency
- US residential solar customer acquisition costs set to spike 40% in 2026 before gradual decline (https://woodmac.com/news/opinion/us-residential-solar-customer-acquisition-costs-set-to-spike-40-in-2026-before-gradual-decline)
- Customer Acquisition Cost Benchmarks 2026: By Industry (https://digitalapplied.com/blog/customer-acquisition-cost-benchmarks-2026-industry)
- Customer Acquisition Cost Trends: 2026 Report - Focus Digital (https://focus-digital.co/customer-acquisition-cost-trends)
- How to Reduce Customer Acquisition Costs in 2026 (https://enable3.io/blog/how-to-lower-customer-acquisition-costs)
- B2B Customer Acquisition Cost Insights: How to Cut CAC in 2026 (https://martal.ca/b2b-customer-acquisition-cost-lb)
- Assess Customer Lifetime Value for Long-Term Profitability
- Customer Lifetime Value: An Original Equipment Manufacturers’ Guide to CLV - ClearOps (https://clearops.com/blog/customer-lifetime-value-clv)
- Customer Lifetime Value: Benchmarks & Drivers to Know in 2026 (https://emarsys.com/learn/blog/customer-lifetime-value-benchmarks-drivers)
- 7 Expert Ways to Increase Customer Lifetime Value in 2026 - CloudTalk (https://cloudtalk.io/blog/how-to-improve-customer-lifetime-value)
- aem.org (https://aem.org/news/5-nonroad-equipment-manufacturing-trends-on-the-horizon-for-2026)
- Analyze Cart Abandonment Rate to Improve Checkout Success
- Reduce Cart Abandonment: 8 Solutions to Recover Sales (https://fullstory.com/blog/reduce-cart-abandonment)
- Reduce Cart Abandonment in Ecommerce. How to Convert It? Ways to Reduce Shopping Cart Abandonment | Landmark Global (https://landmarkglobal.com/eu/en/news-insights/how-to-reduce-cart-abandonment-in-ecommerce)
- 10 Strategies to Reduce Shopping Cart Abandonment | STORIS (https://storis.com/blog/reduce-shopping-cart-abandonment)
- How to Reduce Cart Abandonment & Drive More Sales - Klaviyo (https://klaviyo.com/blog/reduce-cart-abdonment)
- Saving the sale: New ideas for averting cart abandonment (https://retaildive.com/news/saving-the-sale-new-ideas-for-averting-cart-abandonment/435269)
- Measure Repeat Purchase Rate to Foster Customer Loyalty
- Why Customer Loyalty Is Important For Business Growth (https://yotpo.com/blog/why-customer-loyalty-is-important)
- How to Build Customer Loyalty: 5 Tips for Small Businesses (https://uschamber.com/co/grow/customers/small-business-customer-loyalty-strategies)
- How to Increase Customer Loyalty and Retention (https://emarsys.com/learn/blog/increase-customer-loyalty-retention)
- 10 Strategies for Building Customer Loyalty - EasyPost (https://easypost.com/blog/2025-04-01-building-customer-loyalty)
- The New Rules of Customer Loyalty in Manufacturing (https://coastalcloud.us/resources/the-new-rules-of-customer-loyalty-in-manufacturing)
- Calculate Return on Investment for Strategic Decision-Making
- aem.org (https://aem.org/news/5-nonroad-equipment-manufacturing-trends-on-the-horizon-for-2026)
- Embracing Digital Transformation for Marketing ROI (https://industrytoday.com/embracing-digital-transformation-for-marketing-roi)
- The ROI of Marketing Automation in Manufacturing Campaigns | Comosoft (https://comosoft.us/articles/the-roi-of-marketing-automation-in-manufacturing-campaigns)
- Maximizing Digital Marketing ROI in Manufacturing (https://workshopdigital.com/blog/maximizing-digital-marketing-roi-in-manufacturing)
- Equipment ROI Calculator | What's Good ROI for New Equipment? (https://carriervibrating.com/resources/blog/return-on-investment-manufacturing-equipment)
- Utilize Net Promoter Score to Gauge Customer Satisfaction
- Updated 2026 NPS Benchmarks by Industry & Trends | Merren CX (https://merren.io/what-is-a-good-net-promoter-score)
- Consumer NPS Benchmarks: 28 Top B2C Scores for 2025 (https://customergauge.com/benchmarks/blog/consumer-nps-benchmarks)
- Manufacturing (https://customergauge.com/benchmarks/industry/manufacturing)
- Net Promoter Score (NPS): The Ultimate Guide - Qualtrics (https://qualtrics.com/articles/customer-experience/net-promoter-score)
- Track Revenue Per Visitor to Optimize Online Performance
- Heavy Equipment Marketing Benchmarks: Your 2026 Guide to Besting Industry Standards - WebFX (https://webfx.com/industries/heavy-equipment/marketing-benchmarks)
- How Manufacturing Websites Benefit from Optimized Web Hosting for Performance & Lead Generation (https://lform.com/blog/post/how-manufacturing-websites-benefit-from-optimized-web-hosting-for-performance-lead-generation)
- Best Practices for Manufacturing Websites (https://foremostmedia.com/resources/blog/posts/best-practices-for-manufacturing-websites)
- 10 Website Optimization Tips for B2B Manufacturers (https://altitudemarketing.com/blog/manufacturer-website-optimization)
- 4 Best Practices for Effective Manufacturing Website Design (https://marketveep.com/blog/4-best-practices-for-effective-manufacturing-website-design)


